
Citation
Giannopoulos, N.G., Michalopoulos, I.,
Papandreou, N.C., Malatras, A., Iconomidou, V.A., and Hamodrakas, S.J.
(2013). LepChorionDB, a database of Lepidopteran chorion proteins and a
set of tools useful for the identification of chorion proteins in
Lepidopteran proteomes. Insect Biochem Mol Biol 43, 189-196.
Basic
Theory
The major component of the eggshell (90-95%) of many insect and fish eggs
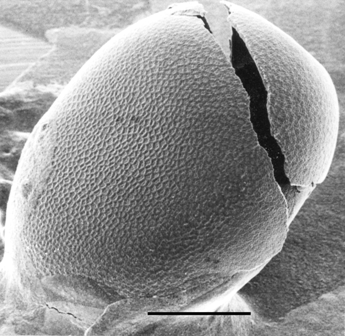
is chorion (Kafatos et al., 1977). Fig. 1A shows a scanning
electron micrograph of a Bombyx mori chorion, a typical chorion of
Lepidoptera. Proteins account for more than 95% of its dry mass. This
proteinaceous shell forms the outer layer of the eggshell and has
extraordinary mechanical and physiological properties, protecting the
oocyte and the developing embryo from a series of environmental hazards
such as temperature variations, mechanical pressure, proteases, bacteria,
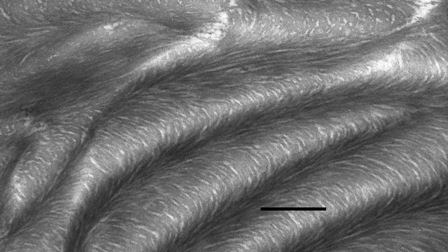
viruses etc. Fig.1B shows an electron micrograph of a thin transverse
section of a silkmoth chorion. A lamellar ultrastructure of packed
fibrils is seen: silkmoth chorion is a biological analogue of a
cholesteric liquid crystal. The proteinaceous Lepidopteran silkmoth
chorion is used in our lab, as a model system towards unraveling the
routes and rules of formation of natural protective amyloids (Iconomidou
and Hamodrakas, 2008). Therefore, we constructed a relational database,
available on the web, containing all Lepidoptera chorion proteins
identified to date.
Lepidoptera chorion proteins can be classified into two major protein
families, A and B. This classification was based on multiple sequence
alignments of conserved key residues, in the central domain of well
characterised silkmoth chorion proteins. HMMER3 (Eddy, 2009) was used to
build Hidden Markov Models (HMMs), from these core multiple sequence
alignments. Then, these HMMs were used in order to make sensitive
searches against various proteomes and identify chorion proteins of
interest.
| A |
|
| B |
|
Scope of the
database
LepChorionDB is the first database of Lepidoptera class A and B chorionic
proteins. The goal was the collection of sequences and annotations of all
chorionic proteins that have been stored in a series of databases to
date, to facilitate research on chorionic and structural proteins in
general. It is hoped that this database will be of help to genome
annotators in the near future when more arthropod genomes become
available. Furthermore, it is hoped that LepChorionDB will facilitate the
detection of common properties of chorion proteins, as well as the
recognition of important differences that are responsible for chorion
functions. The database will be updated on a regular basis.
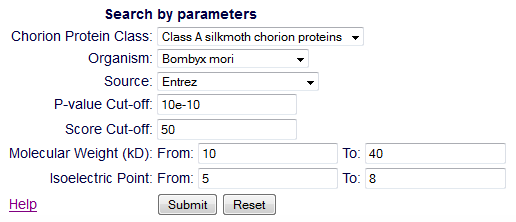
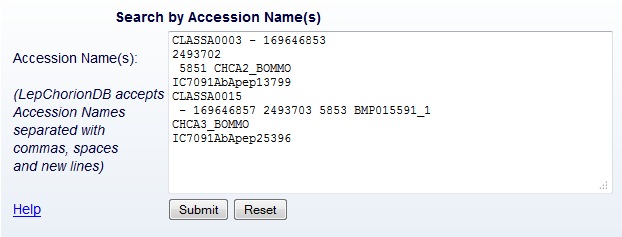
Search
From the 'Search' page, the users retrieve one or more entries. This
search can be done in two ways:
|
|
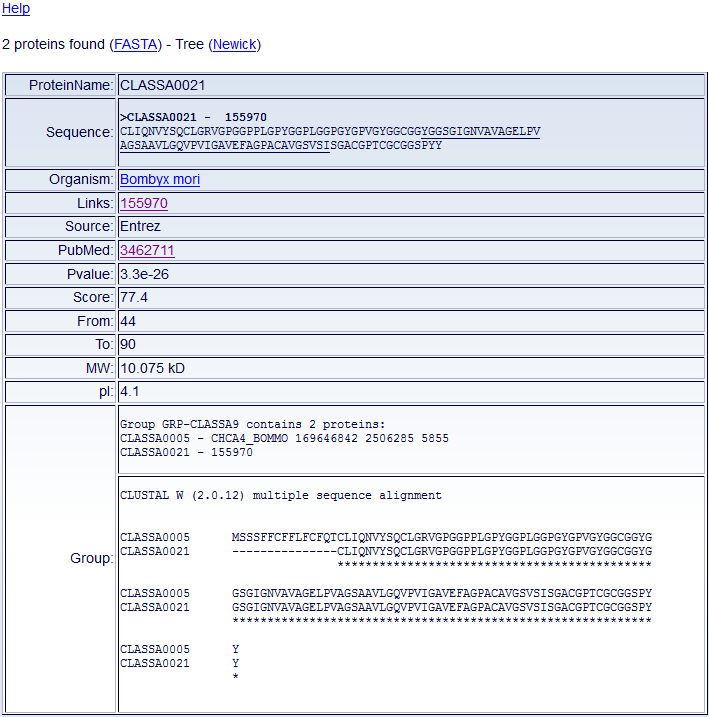
Result Set
After querying the database, one or more Chorion DB tables will appear
(Fig. 4).
|
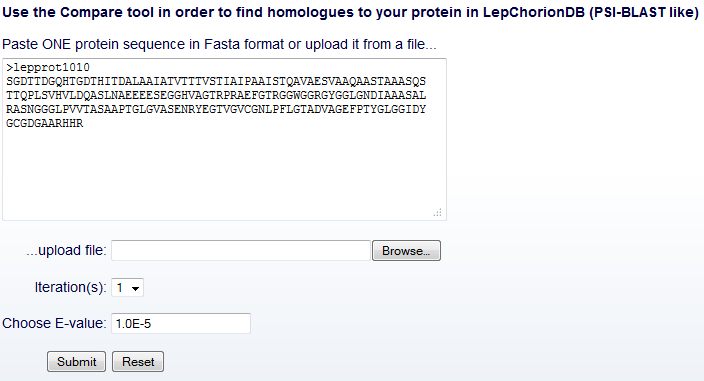
Compare tool
Compare tool is used in order to perform a protein sequence homology
search against LepChorionDB entries. It is based on the jackhmmer program
from HMMER3
software package. Compare tool input is a single protein sequence which
is queried iteratively against LepChorionDB, much as PSI-BLAST would do. The
first round is identical to a phmmer search (BLAST like). All the matches
that pass the inclusion thresholds are put in a multiple alignment. In
the second (and subsequent) rounds, a profile is made from these results,
and the database is searched again with the profile. Iterations continue
either until no new sequences are detected or the maximum number of
iterations is reached (PSI-BLAST like). The given range of iterations to
the user is one to five. The original query sequence is always included
in the multiple alignments, whether or not it appears in LepChorionDB (Eddy,
2009).
Compare
tool - input fields
In the Compare tool input interface, the user can submit the sequence
query and optionally determine another two fields (Fig. 6), as
follows.
|
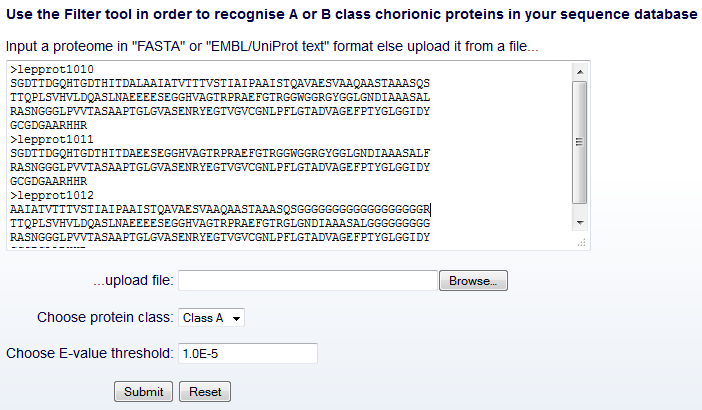
Filter tool
Filter tool is used to recognise class A or B proteins from a protein
sequence database by performing HMM searches.
Filter tool
input interface
In the Filter tool input interface, the user can submit a list of
FASTA-formatted protein sequences and optionally determine another two
fields (Fig. 7), as follows.
|
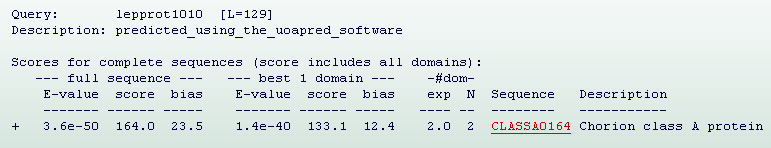
Compare
& Filter tool Output results
Both Compare & Filter tool have the same output results format. The
two sections of the result output are the 'Ranked list of top hits (Fig.
8) and 'Domain annotation for each sequence (and alignments) (Fig. 9)
which are described below:
|
The first section is the sequence top hit list. It is a list of ranked top hits (sorted by E-value, most significant hit first), formatted in a BLAST-like style. The most important number here is the first one, the sequence E-value. This is the statistical significance of the match to this sequence. The lower the E-value, the more significant the hit. The E-value is based on the sequence bit score, which is the second number. This is the log-odds score for the complete sequence. Some people like to see a bit score instead of an E-value, because the bit score does not depend on the size of the sequence database, only on the profile HMM and the target sequence. The next number, the bias, is a correction term for biased sequence composition that has been applied to the sequence bit score. The only time the user really needs to pay attention to this value is when it is large, and on the same order of magnitude as the sequence bit score. This might be a sign that the target sequence is not really a homolog, but merely shares a similar strong biased composition with the query model. The next three numbers are again an E-value, score, and bias, but only for the single best-scoring domain in the sequence, rather than the sum of all its identified domains. The two columns headed #doms are two different estimates of the number of distinct domains that the target sequence contains. The first, the column marked exp, is the expected number of domains according to HMMER's statistical model. It is an average, calculated as a weighted marginal sum over all possible 18alignments. Because it is an average, it is not necessarily a round integer. The second, the column marked N, is the number of domains that HMMER3's domain postprocessing and annotation pipeline finally decided to identify, annotate, and align in the target sequence. This is the number of alignments that will show up in the domain report later in the output file. The last two columns are the name of each target sequence which is linked with LepChorionDB and a description (Eddy, 2009).
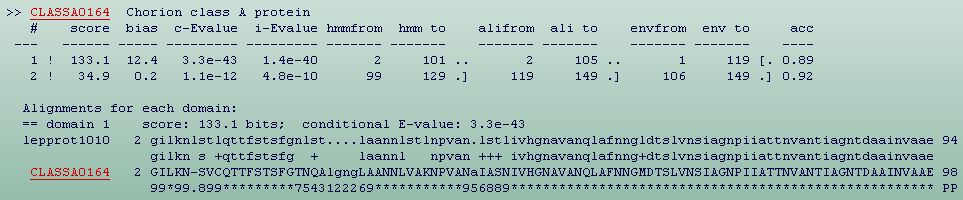
|
In the second section (Fig.9) for each sequence in the top hits list,
there will be a section containing a table of where HMMER3 thinks all the
domains are, followed by the alignment inferred for each domain . Domains
are reported in the order they appear in the sequence, not in order of
their significance. The ! or ? symbol indicates whether this domain does or
does not satisfy both per-sequence and per-domain inclusion
thresholds. The bit score and bias values are as described above for
sequence scores, but are the score of just one domain's envelope. The first
of the two E-values is the conditional E-value. The second number is the
independent E-value. The next four columns give the endpoints of the
reported local alignment with respect to both the query model (“hmm from”
and “hmm to”) and the target sequence (“ali from” and “ali to”).The next
two columns (“env from” and “env to”) define the envelope of the domain’s
location on the target sequence. The last column is the average posterior
probability of the aligned target sequence residues; effectively, the
expected accuracy per residue of the alignment.
Next, at the alignments for each domain section, is following an “optimal
posterior accuracy” alignment (Holmes, 1998) which is computed within
each domain's envelope, and displayed. The line starting with a user's
protein name, here lepprot1010, is the consensus of the query model.
Capital letters represent the most conserved (high information content)
positions. Dots (.) in this line indicate insertions in the target
sequence with respect to the model. The midline indicates matches between
the query model and target sequence. A + indicates positive score, which
can be interpreted as “conservative substitution”, with respect to what
the model expects at that position. The line starting with a LepChorionDB
accession name, here CLASSA0164, is the target sequence. Dashes (-) in
this line indicate deletions in the target sequence with respect to the
model. The bottom line represents the posterior probability (essentially
the expected accuracy) of each aligned residue. A 0 means 0-5%, 1 means
5-15%, and so on; 9 means 85-95%, and a * means 95-100% posterior
probability. These posterior probabilities can be used to decide which
parts of the alignment are well-determined or not. The user will also see
expected alignment accuracy degrade at the ends of an alignment (Eddy,
2009). For more information please refer to HMMER3 User guide.
References
Iconomidou, V.A., and Hamodrakas, S.J. (2008). Natural protective
amyloids. Curr Protein Pept Sci 9, 291-309.
Eddy, S.R. (2009). A new generation of homology search tools based on
probabilistic inference. Genome Inform 23, 205-211.
Altschul, S.F., Gish, W., Miller, W., Myers, E.W., and Lipman, D.J.
(1990). Basic local alignment search tool. J Mol Biol 215, 403-410.
Edgar, R.C. (2004a). MUSCLE: a multiple sequence alignment method with
reduced time and space complexity. BMC Bioinformatics 5, 113.
Edgar, R.C. (2004b). MUSCLE: multiple sequence alignment with high
accuracy and high throughput. Nucleic Acids Res 32, 1792-1797.
Lipman, D.J., and Pearson, W.R. (1985). Rapid and sensitive protein
similarity searches. Science 227, 1435-1441.
Pearson, W.R., and Lipman, D.J. (1988). Improved tools for biological
sequence comparison. Proc Natl Acad Sci U S A 85, 2444-2448.
Kafatos, F.C., Regier, J.C., Mazur, G.D., Nadel, M.R., Blau, H.M.,
Petri, W.H., Wyman, A.R., Gelinas, R.E., Moore, P.B., Paul, M.,
Efstratiadis, A., Vournakis, J.N., Goldsmith, M.R., Hunsley, J.R.,
Baker, B., Nardi, J., and Koehler, M. (1977). The eggshell of insects:
differentiation-specific proteins and the control of their synthesis
and accumulation during development. Results Probl Cell Differ 8, 45-145.
Dawson, R.M.C., Elliott, D.C., Elliott, W.H., Jones, K.M. (1989) Data for
Biochemical Research. 3rd edition, Oxford Science Publications.
Halligan, B.D. (2009) ProMoST: A Tool for Calculating the pI and
Molecular Mass of Phosphorylated and Modified Proteins on Two-Dimensional
Gels. Methods Mol Biol 527, 283-298.
Holmes, I. (1998). Studies in Probabilistic Sequence Alignment and
Evolution. PhD Thesis, University of Cambridge.
Acknowledgements
This work was a collaboration of the Department of Cell Biology and
Biophysics, University of Athens and the Centre of Immunology &
Transplantation Biomedical Research Foundation, Academy of Athens.